Traces are documenting LLM interactions in callback systems called Spans. So each Trace is a collection of Spans collected for a given user interaction with the LLM system (usually via the frontend chat).
Spans
Spans are callback systems that document the interactions with the LLM. They can refer to any unit of execution in the LLM pipeline.
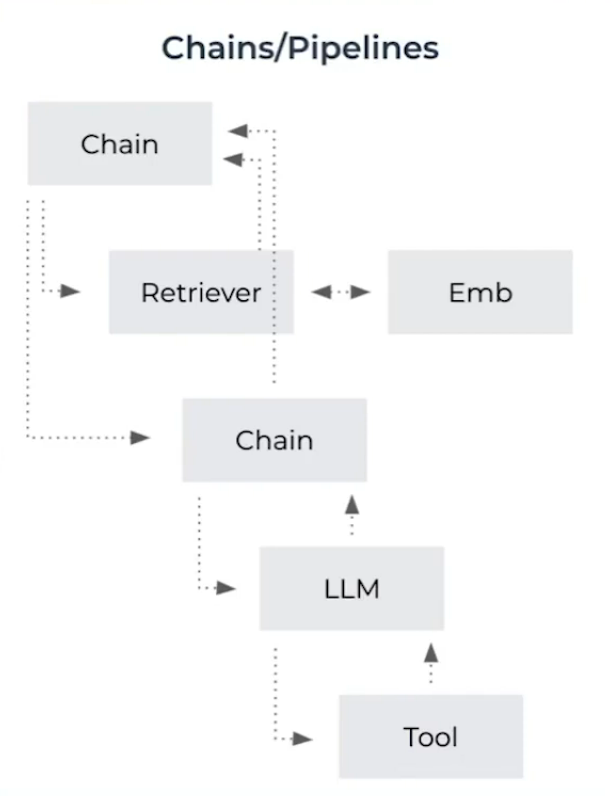
Bellow is an example illustrating one trace (one single interaction). And each unit of execution in the following trace is a span.
Most common span types
LLM - Call to a LLM for completion or chat.
Chain - Link between application steps.
Tool - API or Function invoked on behalf of an LLM.
Agent - Root of a set of LLM and Tools invocations.
Embedding - Encoding of unstructured data.
Retriever - Query for context from a data store.
Reranker - Relevence based re-ordering of documents.
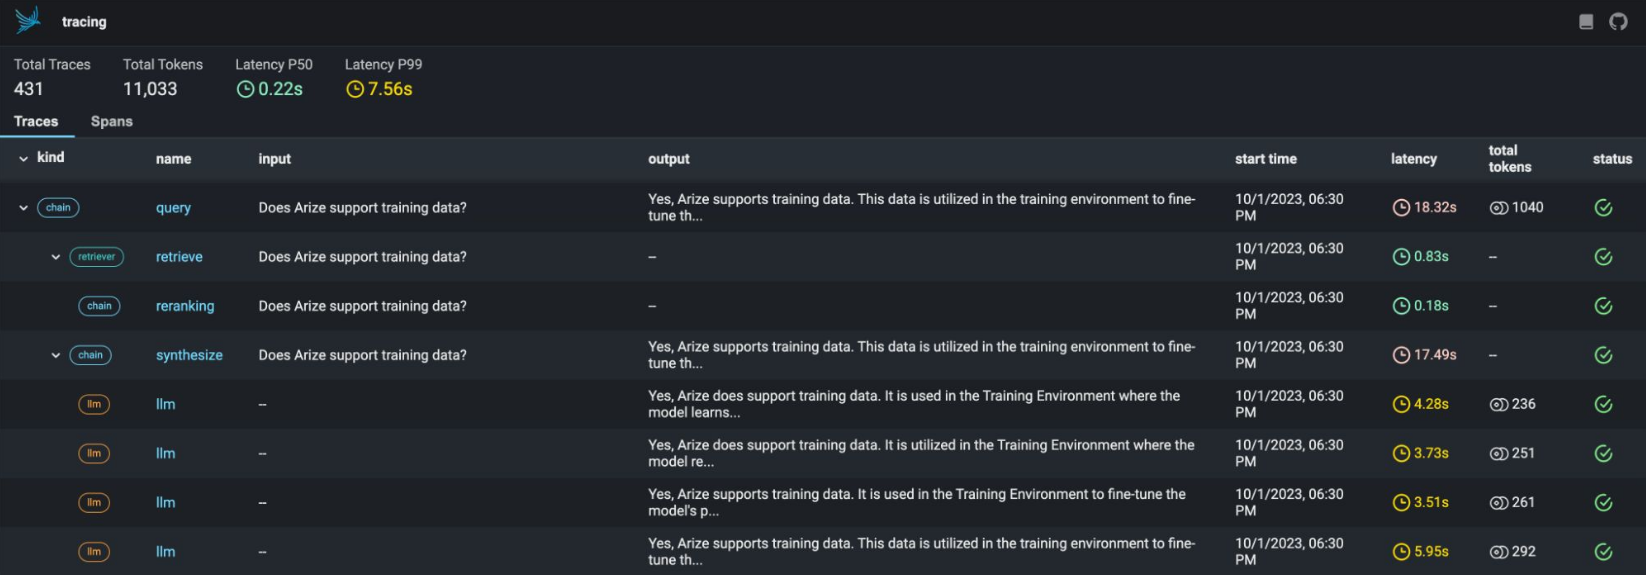
Here is an example from the Arize Phoenix debugging tool.
Such tools can generally be used to:
highlight the application latencies
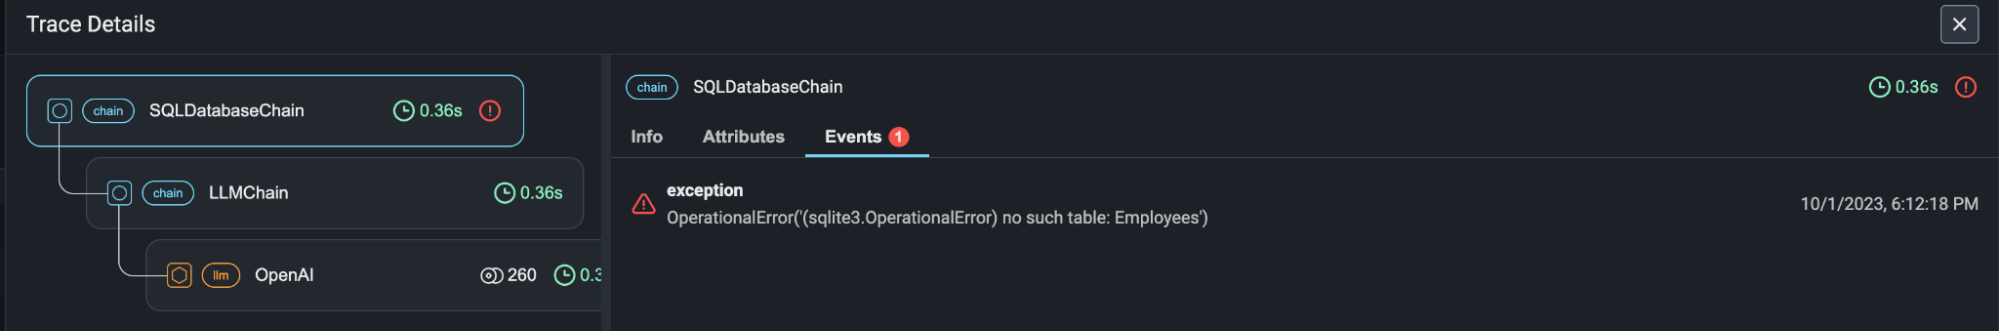
capture runtime exceptions
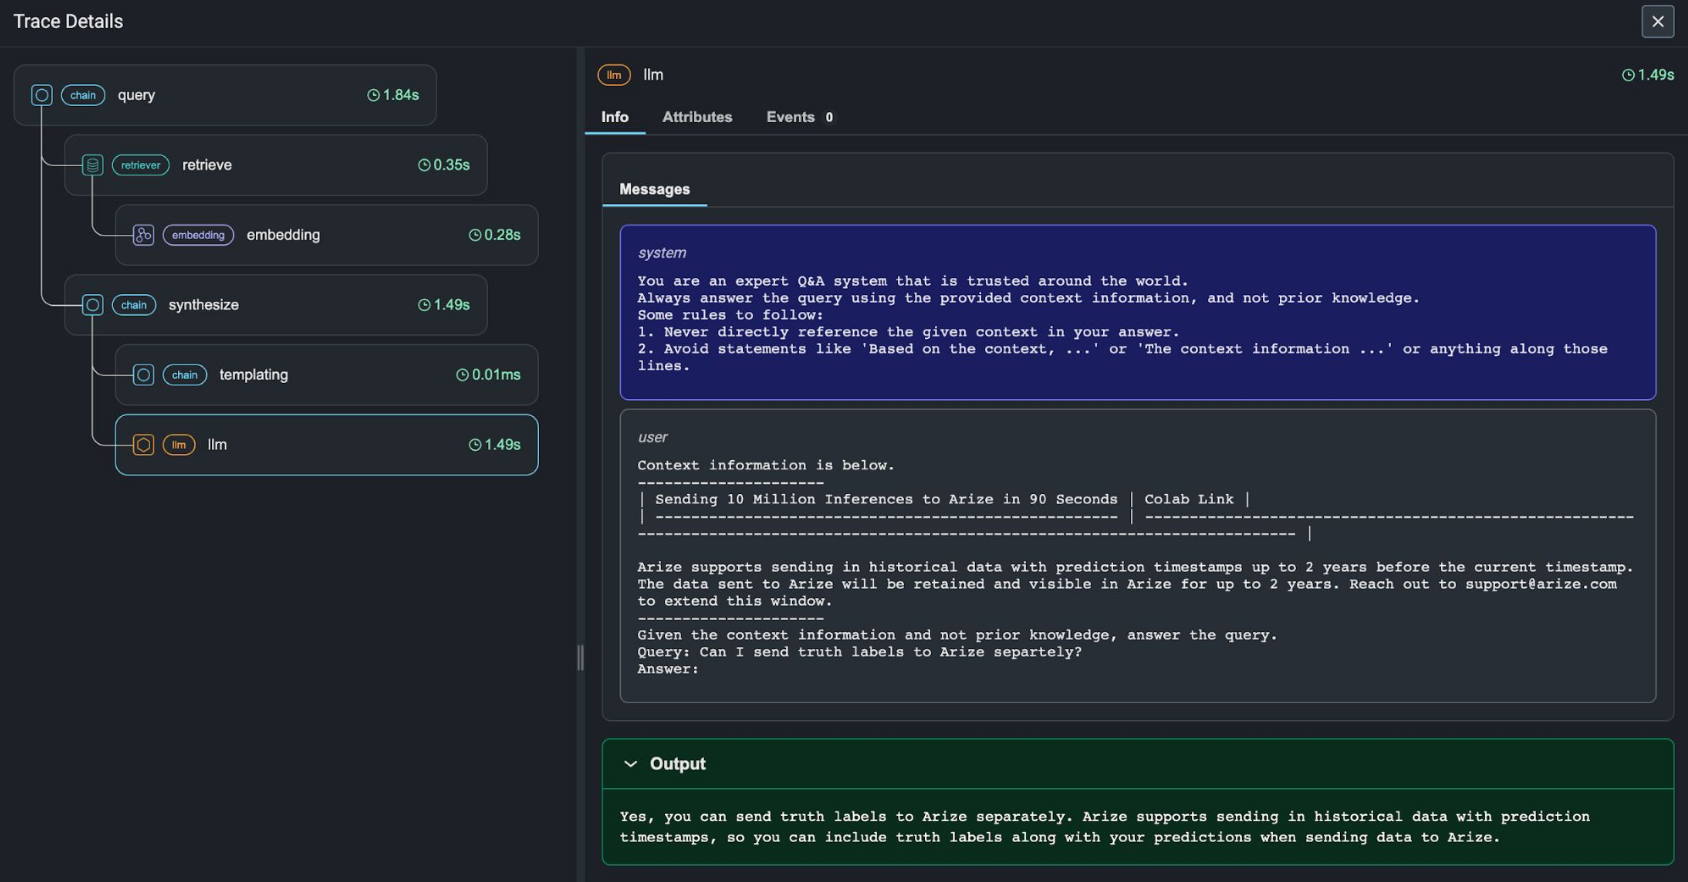
display the prompt template and the variable used
display the token usage
view the embedding text and the embedding model infos
view the retrieved documents along with their scores
display the LLM parameters used (temperature, system prompt, ...)
Notebooks from Arize Phoenix
Lab 1
Tracing and Evaluating a LlamaIndex + OpenAI RAG Application
Topics: LlamaIndex, OpenAI, retrieval-augmented generation
Lab 2
Tracing and Evaluating a LlamaIndex OpenAI Agent
Topics: LlamaIndex, OpenAI, agents, function calling
Lab 3
Tracing and Evaluating a Structured Data Extraction Application with OpenAI Function Calling
Topics: OpenAI, structured data extraction, function calling
Lab 4
Tracing and Evaluating a LangChain + OpenAI RAG Application
Topics: LangChain, OpenAI, retrieval-augmented generation
Lab 5
Tracing and Evaluating a LangChain Agent
Topics: LangChain, OpenAI, agents, tools, function calling
Lab 6
Tracing and Evaluating a LangChain + Vertex AI RAG Application
LangChain, Vertex AI, retrieval-augmented generation
Lab 7
Tracing and Evaluating a LangChain + Google PaLM RAG Application
Topics: LangChain, Google PaLM, retrieval-augmented generation